Structure-Activity Relationship (SAR) Analysis
Every compound you have synthesized—across every SAR round, every selectivity panel, every ADMET assay—is a data point containing predictive signal. Most teams leave that signal buried in spreadsheets and ELN entries. The MagHelix™ SAR platform extracts it: statistical pattern recognition, quantitative QSAR models, and graph neural networks transform your historical data into ranked, synthesis-ready design hypotheses. Whether you are a seed-stage biotech trying to avoid synthetic dead-ends or a pharma team navigating complex target selectivity, we deliver predictive intelligence that directs your next analog before a reagent is ordered.
Why SAR Analysis Is the Critical Intelligence Layer Between Data and Design
SAR analysis transforms your compound data into actionable design intelligence. Yet the majority of teams leave that signal buried in spreadsheets and ELN entries—relying on visual intuition to navigate activity cliffs, selectivity trade-offs, and late-stage ADMET liabilities. Seed-stage biotechs burn runway on synthesis cycles that "feel right" but lack quantitative justification. Pharma teams pursuing difficult targets watch standard fingerprint-based SAR fail on shallow pockets and dynamic PPI interfaces. We deploy statistical modeling, QSAR, and interpretable graph neural networks to extract predictive patterns from your historical data, directing synthesis toward analogs the models validate and away from those the data already suggests will underperform.
Why Choose Our SAR Service
Data-First, Not Assumption-First
Matched molecular pair analysis (MMPA) and recursive partitioning extract quantitative activity trends from your existing datasets—replacing visual intuition with statistical evidence. AI solubility and aggregation classifiers pre-filter compound proposals before they enter the synthesis queue, conserving protein and synthetic budget.
Structure-Enhanced, Not Structure-Blind
For targets with available co-crystal or Cryo-EM structures, we encode 3D pharmacophore constraints, protein-ligand interaction fingerprints (PLIF), and MD-derived pocket flexibility metrics directly into GNN training graphs—transforming flat 2D SAR into dynamic, conformationally aware predictions for PPIs, allosteric sites, and membrane proteins.
Hypothesis-to-Synthesis Under One Roof
Design hypotheses route directly to our Structure-Guided Medicinal Chemistry team for parallel synthesis. Each assay round feeds back into active learning model updates within 2–3 weeks, compressing the cycle between computational prediction and experimental validation without vendor handoffs.
SAR Technology Suite
Statistical SAR Mapping & Visualization
Pattern Recognition at Scale

Key Features:
- Matched Molecular Pair Analysis (MMPA): Automatically identifies pairs of compounds differing by a single structural transformation, quantifying the exact contribution of each R-group change to activity.
- Activity Cliff Detection: Flags single-atom or single-bond modifications that cause dramatic potency shifts—critical information for avoiding destabilizing substitutions.
- Interactive SAR Heatmaps: Visualizes activity landscapes across chemical series, enabling project teams to identify "hot" and "cold" structural regions at a glance.
Ideal For: Early-stage programs with 50–200 compounds seeking to understand the initial SAR landscape; projects where visual pattern recognition has reached its limits.
What We Offer:
For biotechs without internal cheminformatics infrastructure, this is how you extract institutional knowledge from your existing data without hiring a computational chemist. For pharma teams, MMPA provides objective, quantitative confirmation of medicinal chemistry intuition—and often reveals counter-intuitive trends that manual inspection misses.
QSAR Modeling & Activity Prediction
Quantitative Prediction Before Synthesis Commitment

Key Features:
- Multi-Algorithm Benchmarking: Random Forest, Gradient Boosting, XGBoost, and SVM are trained and compared per endpoint to identify the optimal model architecture.
- Scaffold-Split Validation: Ensures models generalize across structurally diverse chemotypes, not just memorizing the training series.
- Structure-Enhanced Descriptor Engineering: For targets with available co-crystal or Cryo-EM structures, we encode 3D pharmacophore constraints, protein-ligand interaction fingerprints (PLIF), and molecular dynamics-derived pocket flexibility metrics as additional graph node features. This structure-augmented SAR outperforms purely ligand-based models by 15–30% on challenging target classes.
- OECD-Compliant Workflow: Defined endpoint, algorithm, applicability domain (AD), and goodness-of-fit parameters—suitable for regulatory submissions (e.g., ICH M7 impurity assessment).
Ideal For: Predicting potency for proposed analogs; prioritizing commercial compound libraries for purchase; supporting regulatory dossiers with validated computational endpoints.
What We Offer:
Every model ships with full validation metrics (Q², R², AUROC), applicability domain boundaries, and a prediction dashboard. You receive not a black box, but a transparent, defensible model with documented limitations—ready for internal decision-making or regulatory review.
ML-Driven Virtual Screening & Activity Cliff Prediction
Graph Neural Networks for Complex Endpoint Prediction

Key Features:
- Graph Neural Network (GNN) Architecture: Processes molecular graphs directly rather than relying on fixed descriptors, capturing subtle stereochemical and topological relationships.
- Activity Cliff Prediction: Identifies structural modifications likely to cause dramatic potency shifts—enabling proactive avoidance of liability-laden analogs.
- Active Learning Integration: Prioritizes the most informative compounds for next-round synthesis, maximizing model improvement per synthesis dollar spent.
Ideal For: Complex biological endpoints (toxicity, cell viability, pathway modulation) where traditional descriptor-based QSAR underperforms; large virtual libraries requiring intelligent prioritization.
What We Offer:
For difficult targets where single-parameter SAR is insufficient, GNN models integrate multi-dimensional biological context—gene, pathway, and protein interaction data—to predict outcomes that structure-only models miss. Active learning ensures your synthesis budget is invested in compounds that maximally improve the model, not just compounds that score well.
SAR Interpretability & Hypothesis Generation
From Black-Box Predictions to Medicinal Chemistry Directives

Key Features:
- SHAP & LIME Explainability: Every prediction includes per-atom and per-substructure attribution scores, identifying exactly which molecular features drive the predicted activity.
- Attention-Based GNN Visualization: Highlights graph nodes (atoms, bonds, functional groups) that most influence the model decision, providing intuitive structural hypotheses.
- Counterfactual Analysis: Proposes minimal structural modifications that would flip a prediction—e.g., "replace the para-chloro with a methoxy to reduce hERG liability by 40%."
Ideal For: Teams needing to justify design decisions to project committees, patent attorneys, or regulatory reviewers; programs where mechanistic understanding is as important as predictive accuracy.
What We Offer:
Interpretability is not an add-on—it is standard. Every model deliverable includes hypothesis reports written in medicinal chemistry language, not data science jargon. Your chemists receive actionable directives: "Add a piperazine at R2 to improve solubility," or "Avoid ortho-substitution on the phenyl ring to maintain kinase selectivity."
Platform Instrumentation
| Instrument | Throughput / Sensitivity |
|---|---|
| NVIDIA DGX A100 | 8× NVIDIA A100 80GB Tensor Core GPUs; distributed training for GNN, Transformer, and ensemble models on million-compound datasets |
| Dell PowerEdge XE8545 | 4× NVIDIA A100/H100 SXM4; GPU-accelerated FEP and MD benchmarking for structure-enhanced descriptor generation |
| NVIDIA RTX A6000 Workstation | 4× NVIDIA RTX A6000; real-time GNN prototyping, SHAP attribution analysis, and active learning loop computation |
| Bruker AVANCE NEO 600 MHz | 600 MHz+ with AI-assisted spectral deconvolution; atomic-level structural confirmation for 3D-SAR input and absolute configuration determination |
Standardized Workflow
Project Workflow
A standardized, milestone-driven execution system. From raw data handoff to predictive model deployment and hypothesis generation—managed by a single project team, tracked in real time.


01 Data Assembly
- Consolidate assay data (potency, selectivity, ADMET) into curated dataset
- Quality checks: outlier detection, assay concordance, salt/tautomer normalization
- Multi-source integration: internal assays + ChEMBL / PubChem / BindingDB
Deliverable: Data summary report + curated dataset
02 Model Training
- Molecular descriptor calculation (Morgan, MACCS, RDKit)
- Multi-algorithm training (RF, GB, XGBoost, SVM, GNN)
- Scaffold-split cross-validation to prevent overfitting
Deliverable: Validated model (Q², R², AUROC) + AD definition
03 Hypothesis Generation
- SHAP / GNN attention analysis for structural driver identification
- Activity cliff prediction and favorable substituent flagging
- Counterfactual proposals for minimal structural modifications
Deliverable: Ranked synthesis target list (potency × accessibility × novelty)
04 Validation & Feedback
- Model deployment as hosted prediction dashboard
- External validation on held-out test sets
- Active learning loop setup for subsequent assay rounds
Deliverable: Deployed interface + model documentation + retraining protocol
05 Integrated Deliverables
- Complete model package with validation report
- Prediction & interpretability report with confidence scores
- Prioritized hypothesis list for medicinal chemistry
- Wet-lab validation loop and structural feedback integration
Deliverable: Final technical report + electronic data package
Sample Requirements
| Requirement | Specification |
|---|---|
| Compound Structures | SMILES, SDFile (.sdf), or chemical name list |
| Assay Data | Associated activity data (IC₅₀, Kd, Ki, % inhibition, etc.) |
| Assay Format | Target or endpoint information (primary target, selectivity panel, cell-based vs. biochemical) |
| Data Format | Excel, CSV, SDFile, or direct database export |
| Minimum Dataset | 50 compounds with confirmed activity; models improve substantially at 200+ compounds |
Note: Contact us to discuss your specific dataset — we will assess feasibility and recommend the most appropriate modeling approach.
Standard Deliverables
- Curated Dataset & Model Package: validated QSAR models with full validation metrics (Q², R²/AUROC) and applicability domain parameters; delivered as a hosted prediction dashboard or deployable code.
- Prediction & Interpretability Report: activity predictions with confidence scores, SHAP/GNN feature importance analysis, and counterfactual design proposals in medicinal chemistry language.
- Prioritized Hypothesis List: ranked synthesis targets sorted by predicted potency gain, synthetic accessibility, and structural novelty.
- Active Learning Updates: model retraining reports after each new assay round, with revised predictions and updated hypothesis rankings.
Frequently Asked Questions
Case Study
Case Study: Semantic Graph Neural Networks for Predictive Toxicology: A 2022 Benchmark in Knowledge-Enhanced SAR
Goal: Demonstrate that graph neural networks (GNNs) integrated with biological semantic knowledge outperform traditional descriptor-based QSAR methods on complex, multi-dimensional toxicity endpoints—establishing a peer-reviewed precedent for structure-augmented, interpretable SAR analysis.
Key Data:
- Knowledge-enhanced architecture: GNN trained on heterogeneous semantic graphs combining MACCS molecular fingerprints with gene, pathway, and protein–protein interaction data from public databases
- Performance: Superior AUC on Tox21 PXR agonism and HepG2 viability assays versus traditional Random Forest and Gradient Boosting models
- Interpretability: Node-level GNN introspection identified specific chemical substructures and biological pathways driving toxicity predictions
- Robustness: Ablation experiments confirmed that semantic data integration significantly improves generalization across structurally heterogeneous compound sets
Why it matters:
For drug developers, this peer-reviewed benchmark validates that conventional QSAR—relying solely on 2D molecular fingerprints—has reached its ceiling on complex biological endpoints. By embedding compounds within biological knowledge graphs, GNN models capture mechanistic relationships that fingerprint-based methods miss, delivering both higher predictive accuracy and atom-level interpretability. This transforms SAR from a retrospective data table into a prospective, mechanism-aware design engine.
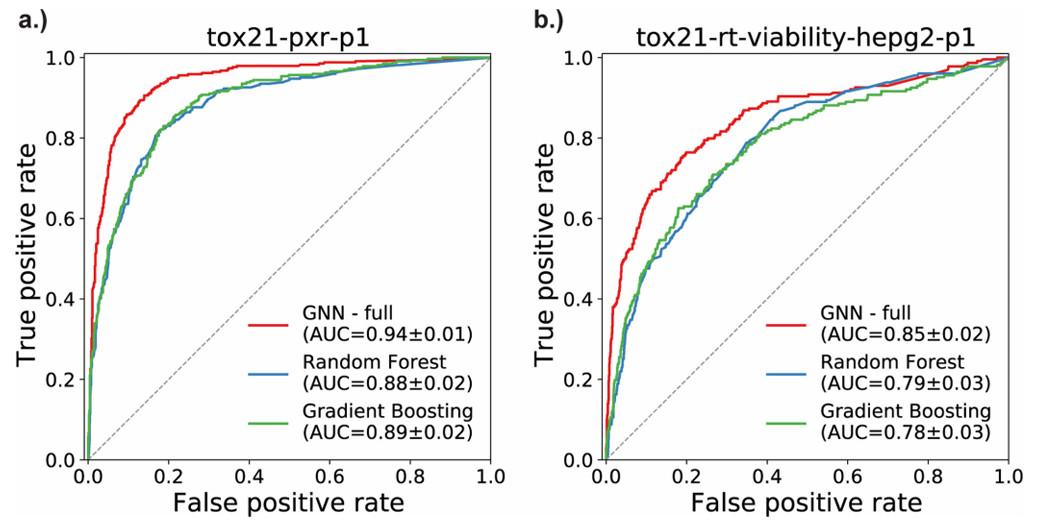
Figure 1. ROC curves comparing GNN, Random Forest, and Gradient Boosting models on Tox21 assays: PXR agonism (a) and HepG2 viability (b). (Romano JD, et al., 2022)
Reference
- Romano JD, Hao Y, Moore JH. Improving QSAR Modeling for Predictive Toxicology using Publicly Aggregated Semantic Graph Data and Graph Neural Networks. Pac Symp Biocomput. 2022;27:187-198.
Our technical team responds within 24 hours. All inquiries protected under NDA.